2013 Survey on the New Recruit's Perception of Work(June 27, 2013)
The Employment Promotion Center (General Manager, Mr. Natsuki Iwama) of the Japan Productivity Center (President, Mr. Masayoshi Matsukawa) and the Junior Executive Council of Japan (President, Mr. Tsunehiro Otsuka) announced the result of 2013 Survey on Perception of Work.
This survey has been conducted since 1965 and is the longest running survey of its kind. Below is the highlight of the 2013 survey.
The percentage of those that could "join the companies they wanted most" was only 52.0% compared to 60.9% in the previous year, the lowest such figure since 2009. The number of college graduates that were recruited by companies as of 1 April 2013 according to Recruitment Survey of College Graduates by the Ministry of Health, Labour and Welfare and the Ministry of Education, Culture, Sports, Science and Technology was 93.9% this year against 93.6% in 2012 and 91.0% in 2011. It suggests that many graduates decided to join companies that were not necessary their first choice.
The choices between "corporate life" or "personal life" and "I want to work more than other people" and "I am fine working like others," more people chose the former reflecting the tight labor market. This trend reversed a bit this year.
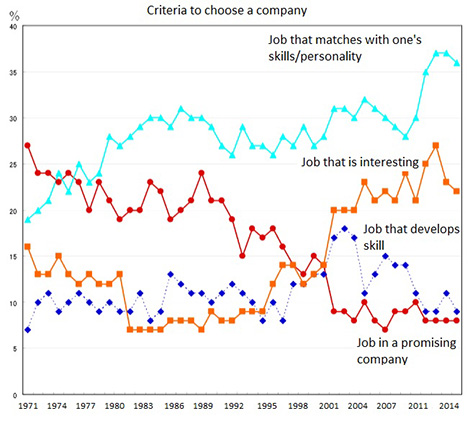
The most common criterion to select the company to join was "job that matches with one's skill/personality" at 37.0%. The "potential of the company," which was the top choice about 40 years ago, was less than 10% for three years in a row.
Regarding how long they want to stay with the same company, "I want to work in this company until retirement" was 30.8% compared to last year's 34.3%, which was the highest such percentage ever. Those who answered "It depends on the circumstance" increased to 33.1% from 31.4% last year.
Regarding the change of official starting date for recruitment activities, those who said "It was good" was 20.1% and those who said "It was not good" was 17.9%. 19.0% of the graduates of 2-year colleges replied positive and only 8.3% replied negative to the same question.
Regarding the choice between work and dating, 84.2% chose work over dating. Between male and female, 0.6% of male respondents and 90.7% of female respondents replied that they will choose work. The same figures were 82.4% for males and 89.8% for females in the previous year.